Results from our 2019 General Election ‘manifesto comparison’ survey are now available, showing data for England, Scotland, and Wales, including results from each constituency. … Read More
Analysis
One vote, one party – but how much do we agree with the party we vote for?
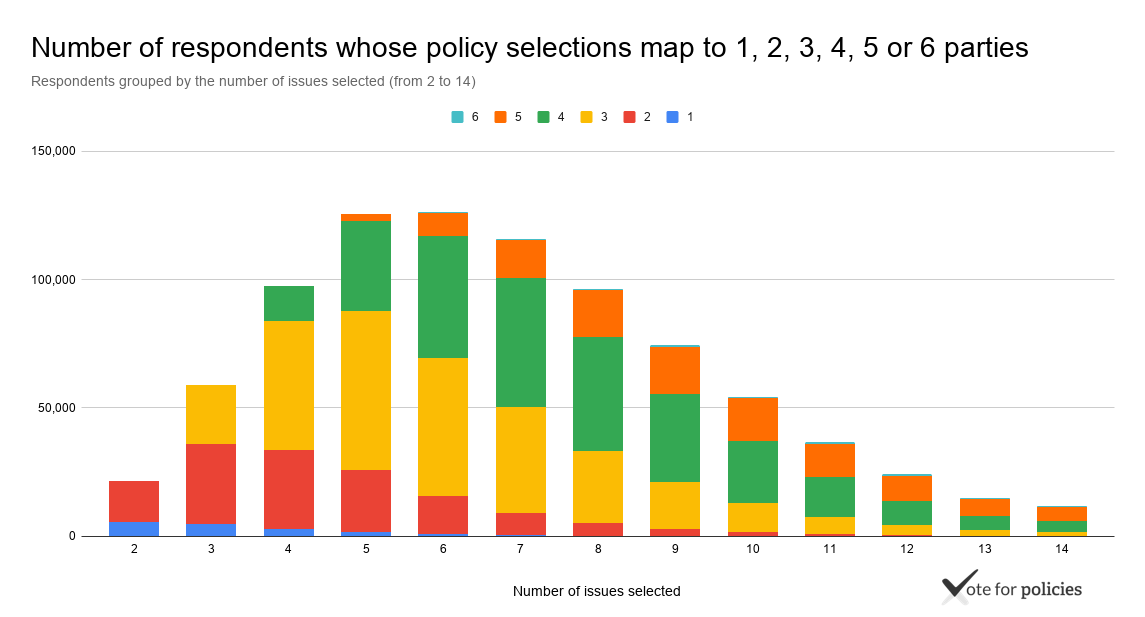
We crunched the numbers from the 1.1 million responses to our pre-election survey in 2019. The ‘average’ respondent bases their political decisions on around 6 issues, and selects policies from three to four different political parties. Just 1.9% of users choose policies from a single party. This article explains our approach to the analysis, and what the results mean for our democracy. … Read More
Policy Tracking in the UK: How we’re tracking the Conservative Party’s 2017 manifesto
Why we started this, our process, and the challenges. … Read More
Our methodology
This page documents our approach to extracting and summarising the policies from the 2017 political manifestos for inclusion in the Vote for Policies 2017 UK general election survey. Our method was discussed with and consulted on by Ben Worthy at … Read More
National poll from TNS reveals most popular policies
Today sees the release of new data that shows policies on Education and Health from UKIP and the Liberal Democrats are the most preferred across Great Britain. The national poll was designed by Vote for Policies and undertaken by social … Read More
Announcing Vote for Policies Data
After we ran Vote for Policies for the 2010 UK General Election we talked about the fascinating insights and things that we could discover if we explored all the data from survey results. This time around, we’re going to do … Read More